Your website just lost another customer. Not because of your product. Not because of your pricing. Because it took too long to load. While you’re reading this sentence, someone clicked on your Google ad, waited three seconds for your page to appear, and hit the back button. That click still cost you money — you just didn’t get anything for it.
If you’ve already read our guide to Core Web Vitals, you know the technical metrics Google uses to measure site speed. And if you want a hands-on diagnostic checklist, our guide to 15 WordPress speed mistakes walks through the most common problems and fixes. This article is the business side of that equation. We’re not going to talk about LCP thresholds or JavaScript optimization. Instead, we’re going to show you exactly how a slow WordPress site is draining your revenue — and make the business case for fixing it.
The Numbers Don’t Lie: Speed and Revenue Are Directly Connected
This isn’t speculation. Some of the largest research firms in the world have quantified the relationship between page load time and money. Here’s what the data says.
1
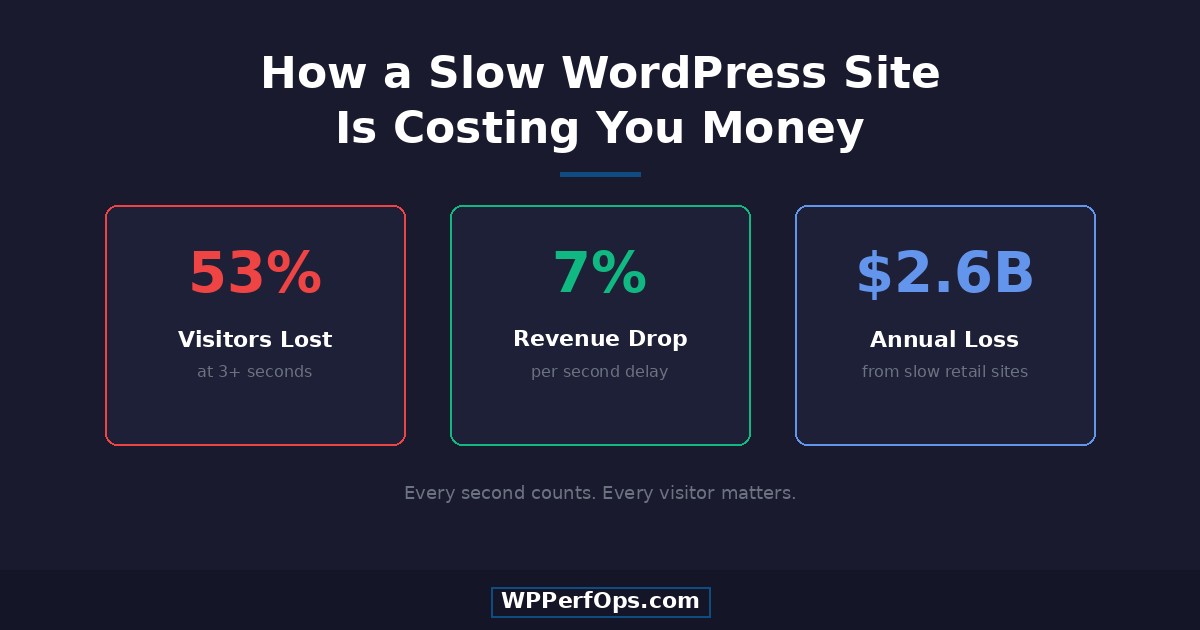
53% of Mobile Visitors Leave if a Page Takes Over 3 Seconds
Google and SOASTA research found that more than half of mobile users abandon a page that takes longer than three seconds to load. That’s not an edge case — that’s the majority of your mobile traffic walking away before they see a single word of your content, a single product image, or a single call to action.
2
7% Drop in Conversions for Every 1-Second Delay
Akamai’s research shows that each additional second of load time reduces conversions by 7%. Put that into real numbers: if your site generates $100,000 per month and your pages take 5 seconds instead of 3, you’re losing roughly $14,000 every month — that’s $168,000 per year — just from two extra seconds. Even a modest site doing $5,000/month in revenue loses over $84,000 annually from preventable slowness.
3
$2.6 Billion in Annual Revenue Lost by Slow-Loading Retail Sites
Radware calculated that slow page loads cost the US retail sector $2.6 billion in lost sales every year. That’s money that customers intended to spend — they had their wallets out — but the website couldn’t deliver the experience fast enough to close the deal. Your slice of that number depends on your traffic and your load times, but the math applies to every online business.
How Slow Load Times Destroy Your Conversion Funnel
The statistics above paint the big picture, but the real damage happens inside your conversion funnel. Deloitte’s landmark study “Milliseconds Make Millions” tracked real user behavior across multiple industries and found that a 0.1-second improvement in site speed increased conversions by 8.4% for retail sites and 10.1% for travel sites. Not seconds — tenths of a second.
Here’s what happens at every stage of the funnel when your site is slow versus fast:
Fast Site
Under 2 Seconds Load Time
Bounce rate: 20-35%
Avg. session duration: 3-5 minutes
Pages per session: 3.5+
Conversion rate: 2.5-4%
Google signal: Positive page experience
Slow Site
Over 4 Seconds Load Time
Bounce rate: 55-75%
Avg. session duration: 30-90 seconds
Pages per session: 1.2
Conversion rate: 0.5-1.5%
Google signal: Poor page experience
The gap between those two columns is the gap between a profitable website and one that’s bleeding money. And the frustrating part? Most site owners have no idea which column they’re in. Their analytics show traffic coming in, but they’re not measuring how much of that traffic bounces before the page even finishes loading — those visitors never trigger an analytics event.
Quick Test
Want to know where your site falls? Run our free mini audit — it takes 30 seconds and will show you your current load times, Core Web Vitals scores, and the specific issues dragging your site down.
Google Is Penalizing Your Slow Site in Search Rankings
Google has been using page speed as a ranking factor since 2010, but the stakes went up dramatically with the Page Experience Update. Core Web Vitals — the metrics that measure loading speed (LCP), interactivity (INP), and visual stability (CLS) — are now explicit ranking signals. If your site fails these benchmarks, Google is less likely to show it to searchers, even if your content is excellent.
The data from Google’s own research confirms the impact: pages that meet Core Web Vitals thresholds see 24% fewer abandonments than pages that don’t. That means users are not only more likely to find your site in search results — they’re more likely to stay once they get there.
Here’s the compounding spiral that makes this so damaging: a slow site gets penalized in rankings, which means less organic traffic. Less traffic means fewer conversions. Fewer conversions mean less revenue to invest in improving the site. Meanwhile, your faster competitors are climbing the rankings, capturing the traffic you lost, and widening the gap. If you want to understand exactly what these metrics are and how they’re measured, our Core Web Vitals guide breaks it all down.
The SEO Speed Advantage
Sites that pass all three Core Web Vitals don’t just avoid penalties — they get a ranking boost. In competitive niches where content quality is similar across the top results, page experience becomes the tiebreaker. Speed can be the difference between position 3 and position 8.
Slow Sites Waste Your Advertising Budget
If you’re spending money on Google Ads, Facebook Ads, or any paid traffic, a slow landing page is like pouring that budget down the drain. You’re paying full price for every click, but you’re only converting a fraction of what you should be — because visitors are leaving before the page loads.
Google Ads uses Quality Score to determine how much you pay per click, and landing page experience is one of its three components. A slow, poorly performing landing page directly increases your cost per click. That means you’re paying more to reach the same audience and converting fewer of them when they arrive.
4
2x Higher Cost Per Acquisition on Slow Landing Pages
When your landing page takes 5+ seconds to load, you’re effectively doubling your cost per acquisition. Consider a business spending $5,000/month on ads with a 3% conversion rate. If slow load times cut that to 1.5%, you’re now paying $2,500/month for conversions you should have gotten for free — that’s $30,000 per year wasted. It’s like paying for a billboard on the highway and then covering it with a tarp.
The Hidden Costs You Might Not Be Counting
The revenue loss and ad waste are the obvious costs. But a slow site creates a cascade of less visible damage that compounds over time:
- Brand perception and trust erosion. Akamai found that 79% of online shoppers who experience a slow site say they won’t return to buy again. Your site speed is your first impression — and you don’t get a second one. Visitors subconsciously equate slow performance with an untrustworthy or unprofessional business.
- Customer lifetime value lost forever. Every visitor who bounces due to slow load times isn’t just a lost sale — they’re a lost relationship. They’ll never sign up for your email list, never become a repeat buyer, and never refer a friend. The compounding value of that lost customer over months and years dwarfs the initial transaction.
- Team productivity drain. A slow front-end usually means a slow wp-admin too. Your content team, your marketing team, and your developers are all wasting minutes every day waiting for pages to load, posts to save, and plugins to respond. Across a team, that adds up to hours per week of lost productivity.
- Opportunity cost of inaction. Every month you delay fixing your site speed is a month of lost conversions you can never recover. Your competitors who invest in speed are capturing the customers you’re losing — and once those customers find an alternative, they rarely come back.
- The mobile-first reality. Over 60% of web traffic now comes from mobile devices, where connections are slower and patience is shorter. If your site isn’t optimized for mobile speed, you’re failing the majority of your audience. Google’s mobile-first indexing means the mobile version of your site is what determines your rankings.
Real Results: What Happens When You Fix It
The cost of a slow site is real — but so is the upside of fixing it. Here are three WordPress sites we optimized, with measurable before-and-after results.
E-commerce Fashion Store
WooCommerce store with 2,000+ products and slow checkout.
Before
PageSpeed
34
6.2s load time
After
PageSpeed
94
1.1s load time
SaaS Marketing Website
Content-heavy marketing site with poor Core Web Vitals.
Before
PageSpeed
41
4.8s load time
After
PageSpeed
97
0.8s load time
Local Restaurant Chain
Multi-location restaurant site struggling with mobile speed.
Before
PageSpeed
28
7.4s load time
After
PageSpeed
96
0.9s load time
How to Calculate What a Slow Site Is Costing You
You don’t need a data science degree to estimate the revenue impact of your site speed. Here’s a simple five-step formula any business owner can follow:
- Find your monthly visitors. Check Google Analytics for your average monthly sessions.
- Find your current conversion rate. Divide monthly conversions (sales, leads, signups) by monthly visitors.
- Estimate the speed penalty. If your site loads in 4+ seconds, research suggests you’re losing 14-21% of potential conversions compared to a sub-2-second site (7% per extra second).
- Calculate lost conversions. Multiply your monthly visitors by the conversion rate improvement you’d gain from faster load times.
- Multiply by your average order value or lead value. That’s the revenue you’re leaving on the table every month.
Worked example: A service business gets 15,000 monthly visitors with a 2% conversion rate and a $200 average sale. That’s 300 conversions and $60,000/month. If their 4.5-second load time is costing them 15% of potential conversions, they’re missing 45 sales per month — that’s $9,000/month or $108,000/year in lost revenue from speed alone.
Don’t Guess — Measure
The formula above gives you a ballpark, but every site is different. Our free mini audit measures your actual load times, identifies specific bottlenecks, and estimates the revenue impact based on your real traffic data. It takes 30 seconds and there’s no commitment.
Keep Learning
Understanding the cost is step one. These guides show you exactly how to fix the speed problems that are hurting your revenue.
E-Commerce Speed
WooCommerce Speed Optimization
Cart fragments, checkout performance, and WooCommerce-specific caching strategies that protect your sales.
The Full Framework
Speed Optimization Checklist
A 33-step framework covering every optimization layer from server to monitoring.
Prevent Regression
Stop Speed From Slipping Back
Why sites get slow again and a monthly maintenance routine to prevent performance regression.
Speed Is Not a Cost — It’s an Investment
Reframe how you think about site speed optimization. It’s not a line item on your expense report — it’s a revenue multiplier. Every dollar you spend on making your site faster comes back as higher conversion rates, lower bounce rates, better search rankings, and more efficient ad spend. Unlike ongoing marketing costs, speed optimization is largely a one-time investment with compounding returns.
The businesses that win online aren’t just the ones with the best products or the biggest ad budgets. They’re the ones that remove friction from the buying process. And the single biggest source of friction on most WordPress sites? Load time.
Every day you wait is another day of lost conversions, wasted ad spend, and declining search rankings. The math doesn’t change — it just gets worse. We offer transparent, one-time pricing with no subscriptions and no hidden fees. You invest once, and the speed improvements keep paying dividends month after month.
Your competitors are getting faster. Your customers are getting less patient. The question isn’t whether you can afford to invest in speed — it’s whether you can afford not to.
Find Out How Much Speed Is Worth to Your Business
Get a free performance analysis with estimated revenue impact. No commitment, no credit card — just data.